Building Resilient & Intelligent Supply Chains: Predict, Adapt, and Optimise in Real-Time
Navigate the complexities of modern supply chains and manufacturing with Pometry. Our natively temporal graph platform empowers you to achieve end-to-end visibility, predict disruptions, automate decisions, and optimise operations by understanding how your entire value chain evolves over time.


Confronting Volatility, Silos, and Inefficiency in Global Operations
Today's supply chains and manufacturing environments face constant disruptions, fragmented data across disparate systems, limited visibility into multi-tier networks, and intense pressure to improve efficiency while mitigating risk. Static tools struggle to keep pace with dynamic demand and complex interdependencies.
Achieve End-to-End Temporal Visibility
Gain a dynamic, historical, and real-time view of your entire supply network, tracking materials, inventory, and shipments as they move and change over time
Build Proactive Resilience & Agility
Anticipate potential disruptions, model cascading impacts, and identify alternative pathways by understanding the temporal behaviour and dependencies within your supply chain.

Transform Supply Chain Resilience with Temporal Graph Intelligence
Pometry helps you master the complexity of modern supply chains by delivering true end-to-end temporal visibility, proactive disruption detection, and AI-powered operational optimisation. Unlock the insights you need to adapt faster, collaborate smarter, and build a more resilient, efficient supply network.
Drive AI-Powered Operational Excellence
Leverage temporal graph analytics and AI to optimise inventory, enhance demand forecasting accuracy, automate logistics decisions, and improve production scheduling.
Foster Seamless Data Collaboration
Unify data from ERPs, MES, WMS, IoT sensors, and logistics partners into a cohesive temporal graph for a shared, actionable view across your ecosystem.


Dynamic Supply Network Modelling & Visualization
Model and visualise your multi-tier supply network, including all dependencies and material flows, as they evolve over time using our intuitive UI.
Predictive Demand Sensing & Forecasting
Improve forecast accuracy by incorporating historical demand patterns, real-time signals, and evolving influencing factors through temporal analytics and AI.
Real-Time Inventory & Logistics Optimization
Optimise inventory levels across locations, enhance logistics routing based on real-time and historical conditions, and minimise lead times with high-performance analytics.
Proactive Disruption Detection & Response
Utilise our Alerts Engine and GraphRAG to proactively identify potential disruptions (e.g., supplier issues, transit delays) and rapidly model optimal responses.
Intelligent Supplier Risk & Performance Management
Analyse supplier dependencies, track performance over time, and proactively identify potential risks within your supplier network using temporal graph insights.
Smart Manufacturing & IoT Data Analytics
Ingest and analyse vast streams of real-time IoT data from manufacturing equipment to predict maintenance needs, optimise production processes, and improve quality control through temporal pattern analysis.
Read our articles

The hidden failures of transformation
Why delivery optimisation is making transformation worse
The Missing Link for AI Agents: Why a Native Temporal Graph is Non-Negotiable

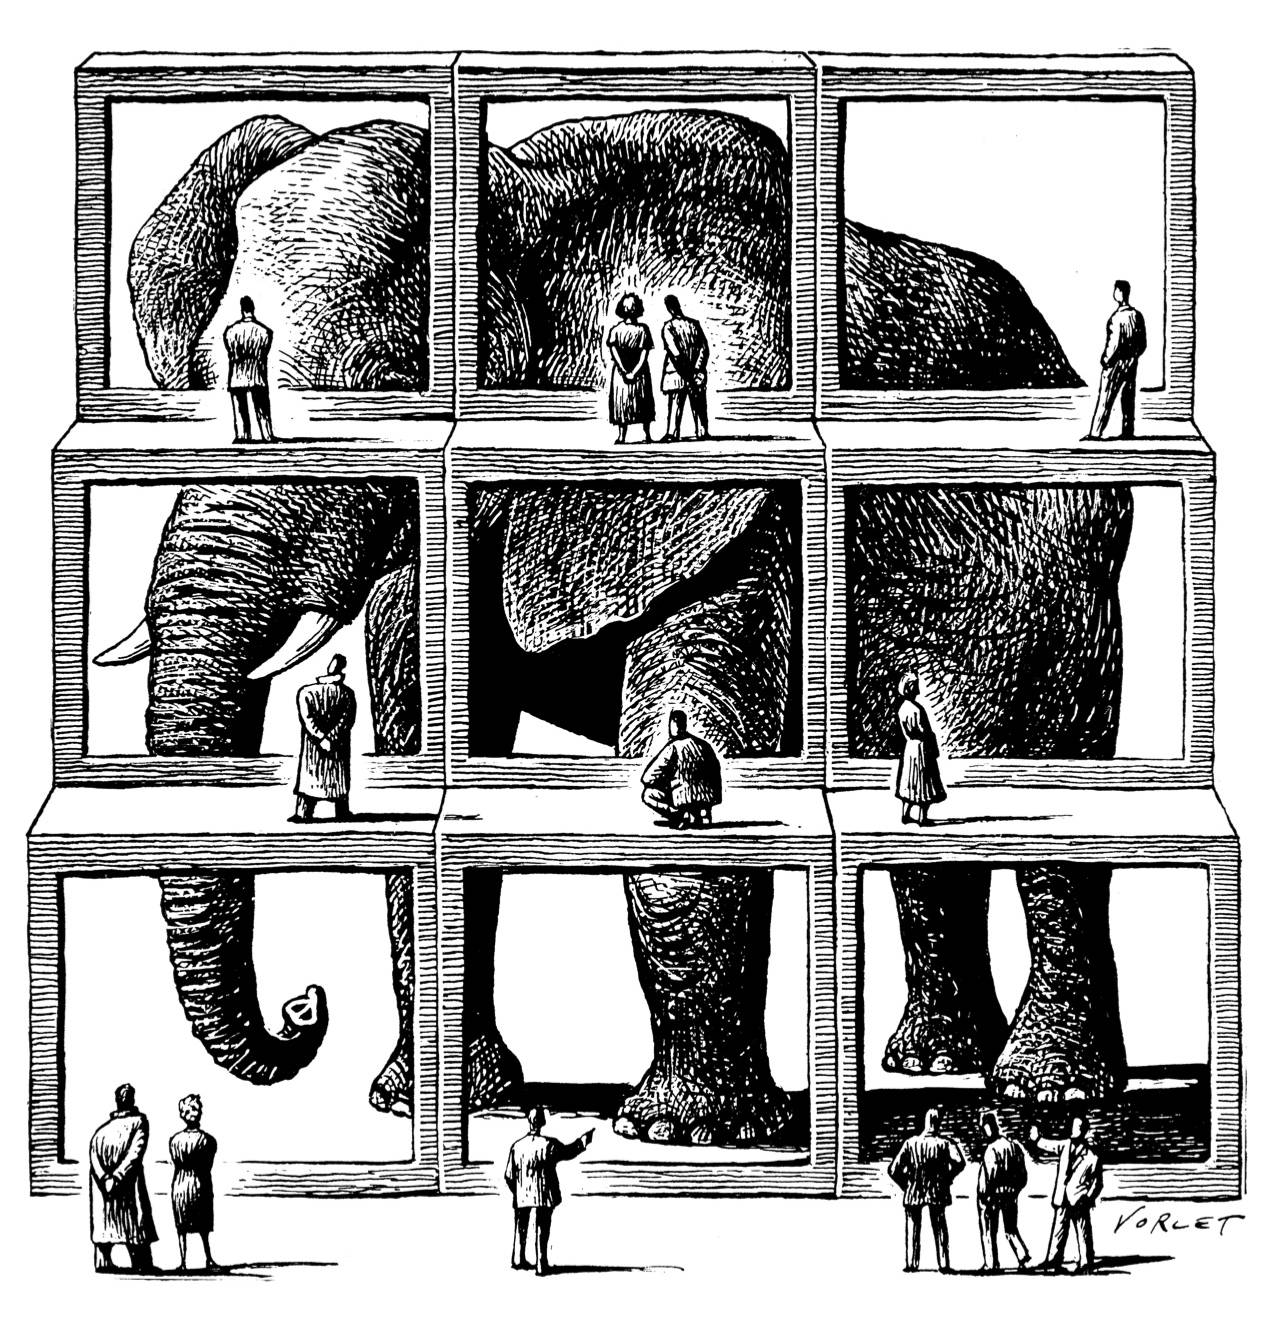
Prisoners Dilemma and advanced Graph analytics

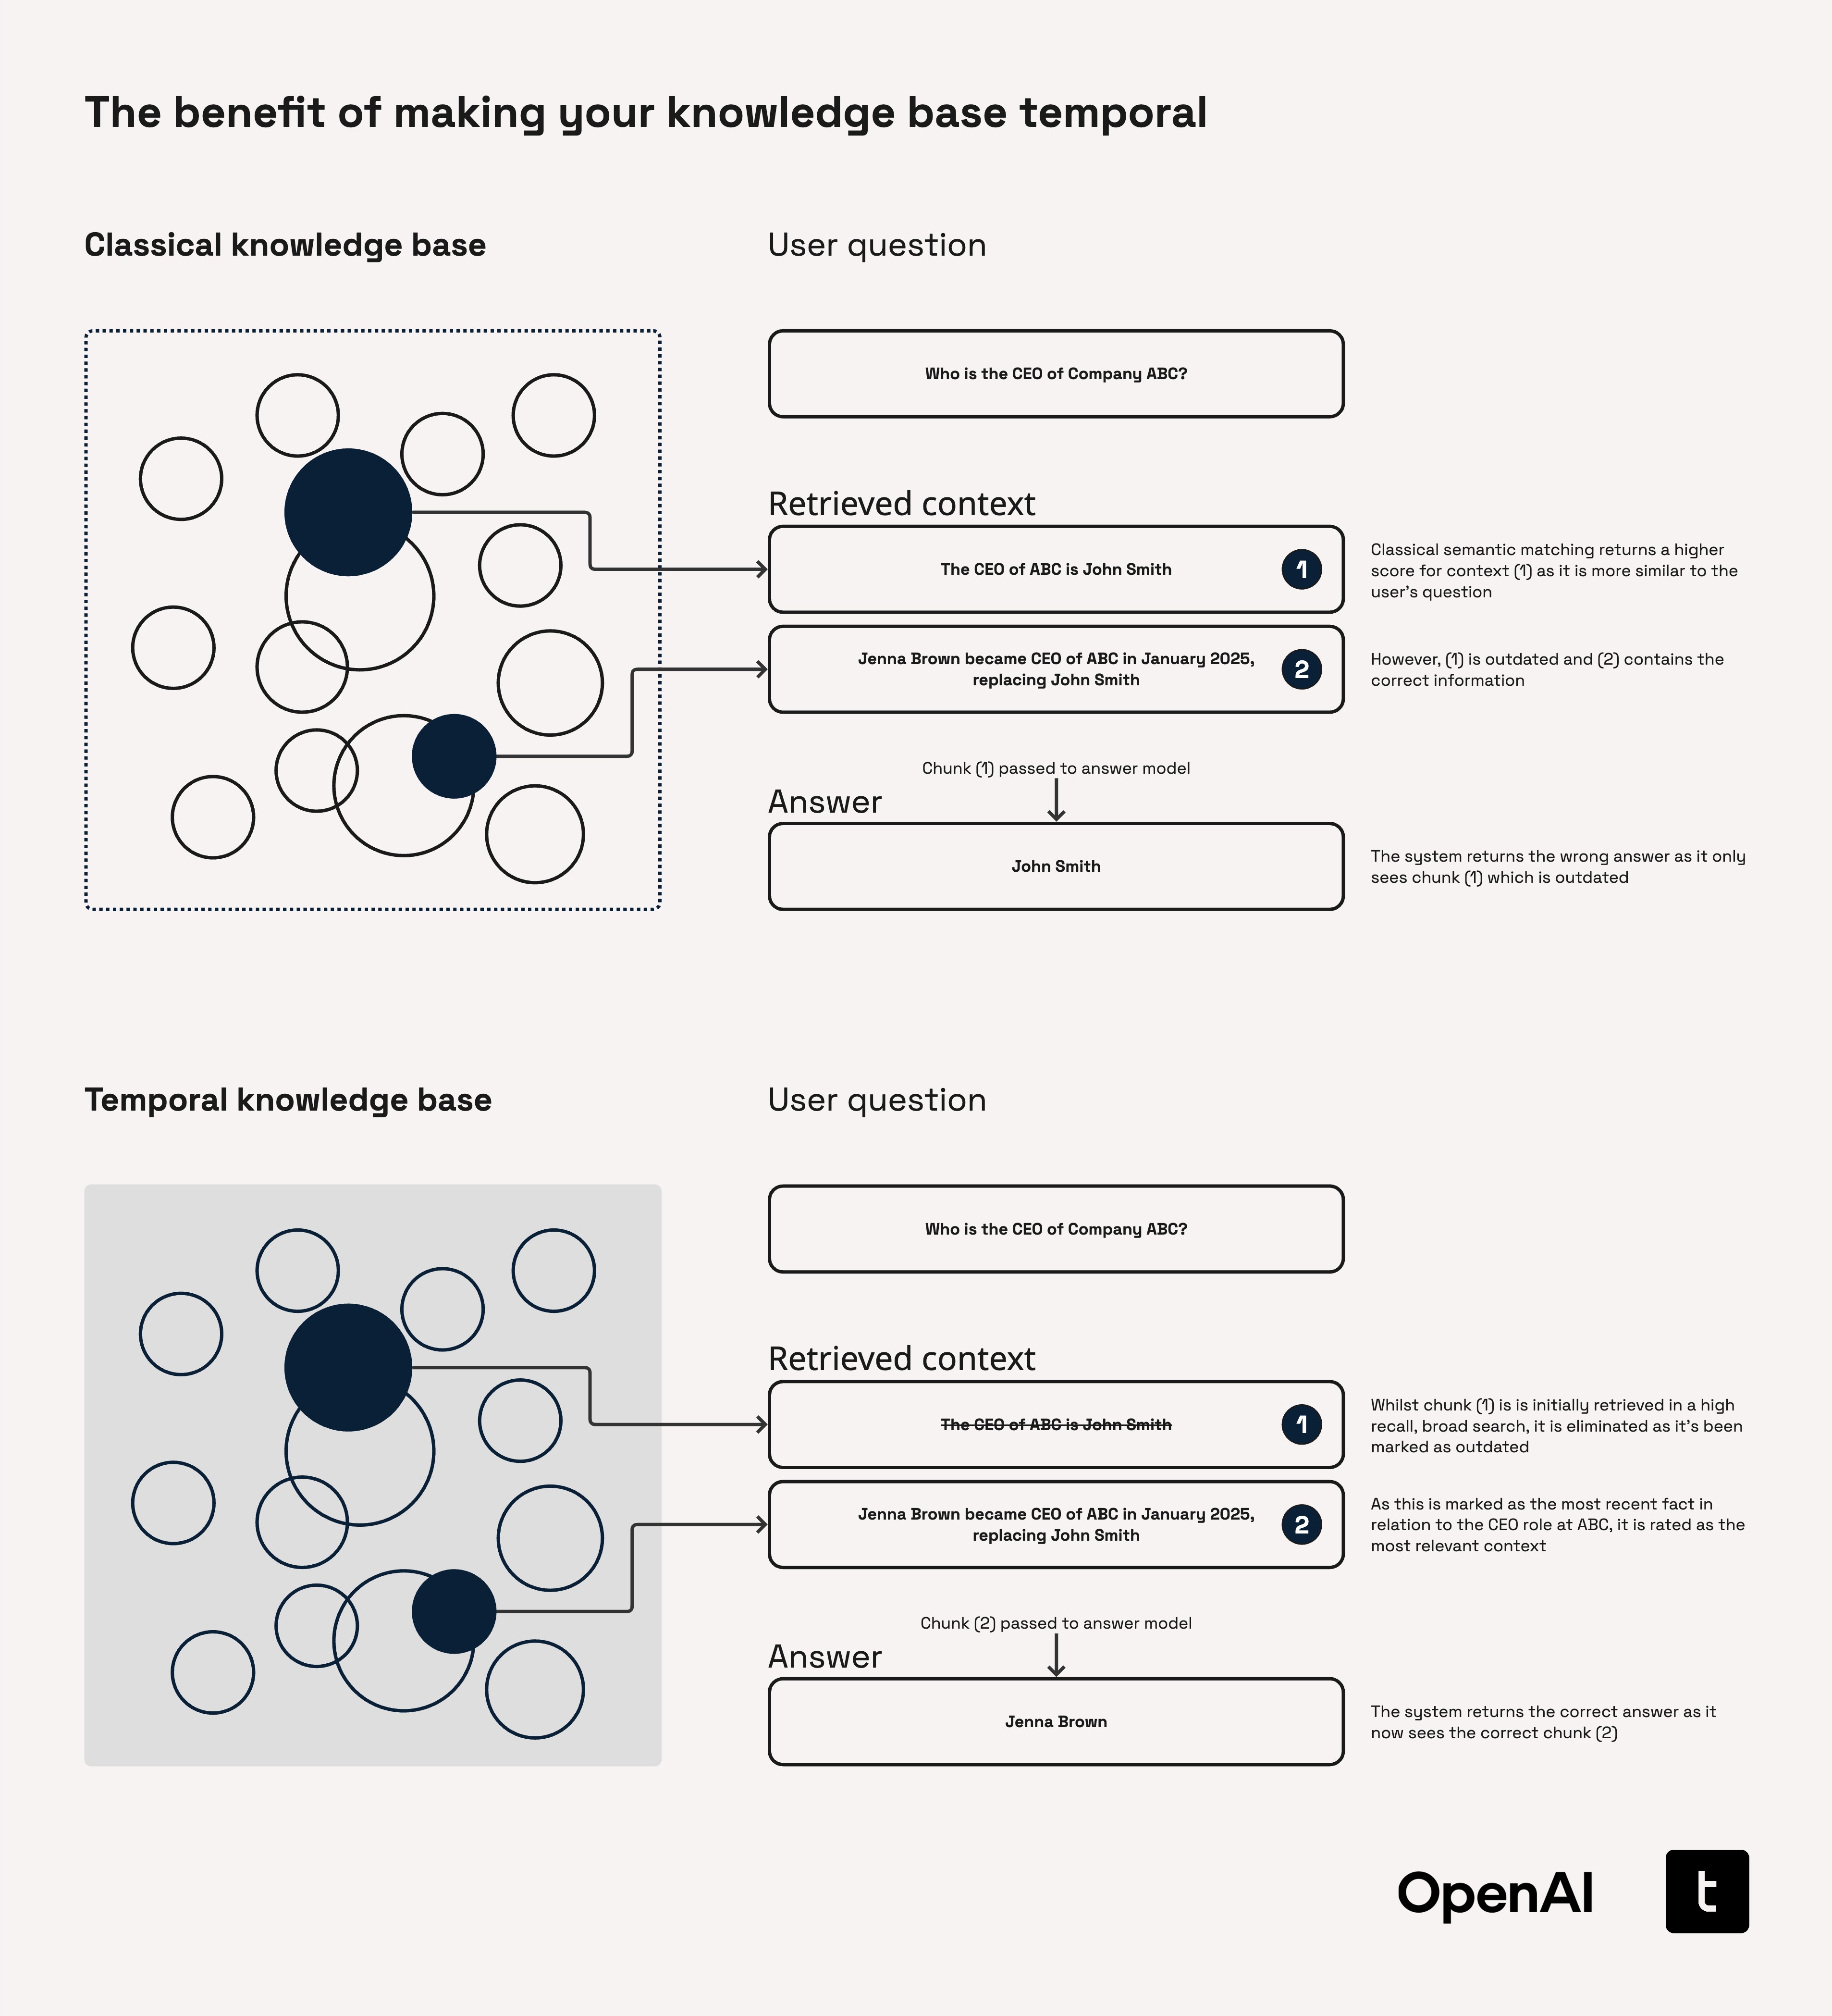
Are Temporal Graphs Relevant to You?
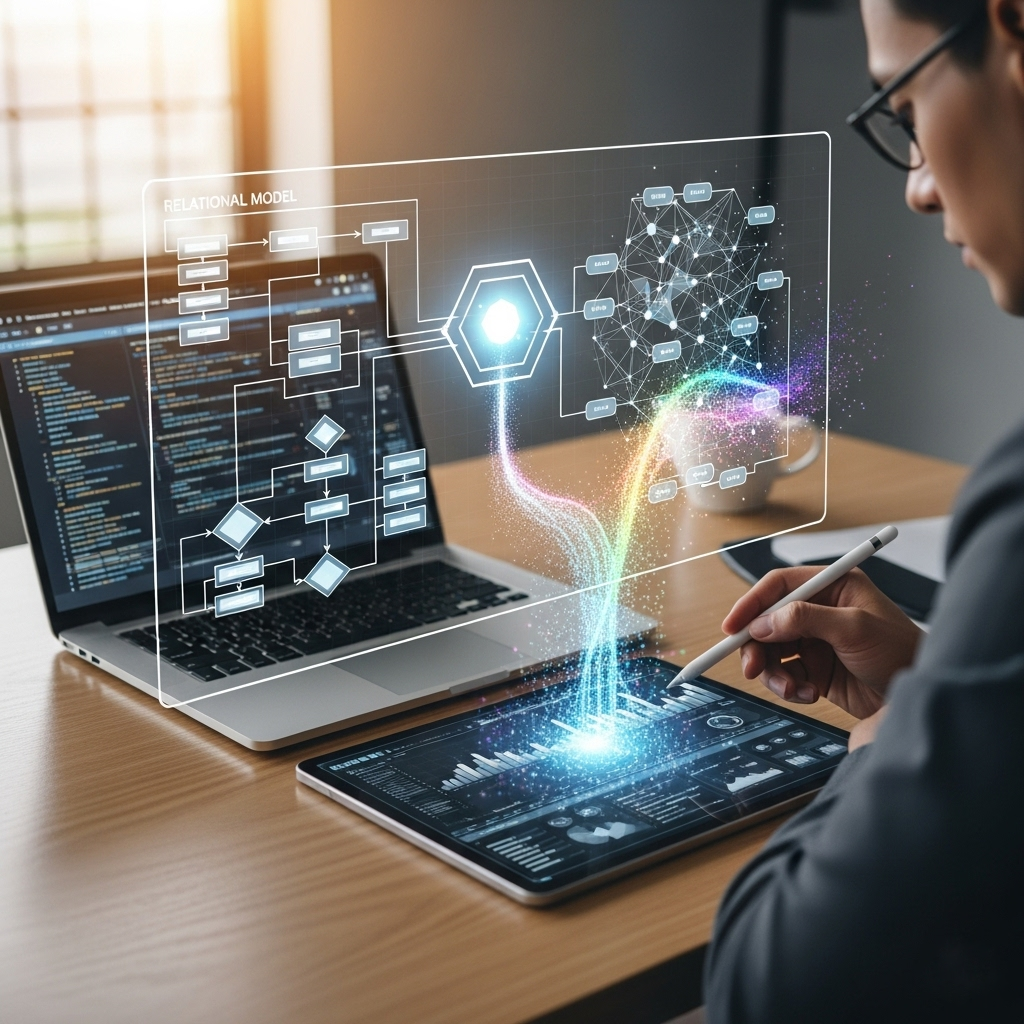
The Graph Model vs. The Relational Model

The Alan Turing Institue: The Dizzy Potential of Dynamic Graphs

Holistic Network Analysis Over Time

Reduce False Positives

High-Performance Investigation at Scale

Advanced Behavioural Sequencing
Unified Temporal Engine for AI

True Semantic Understanding Across Time

High-Performance Context at Scale
Evolving Context Beyond Static Vectors
Dynamic Risk Scoring

Unmasking Collusion & UBOs

Agentic AI Framework Support
.png)
Advanced GraphRAG with Temporal Depth

Build a Smarter, More Resilient Supply Chain with Pometry
Equip your organization with the world's only natively temporal graph platform to achieve true end-to-end visibility, anticipate change, and optimise every facet of your supply chain and manufacturing operations. Discover how Pometry turns complexity into competitive advantage.