Instant Clarity: Explore, Analyse, and Act on Your Data – No Code Required
Step into your data with Pometry’s stunning User Interface. Visually explore complex relationships, interact with our NeuroSymbolic LLM, manage cases, and uncover deep insights from the moment your data is loaded. All with zero coding, in a beautiful and intuitive environment.
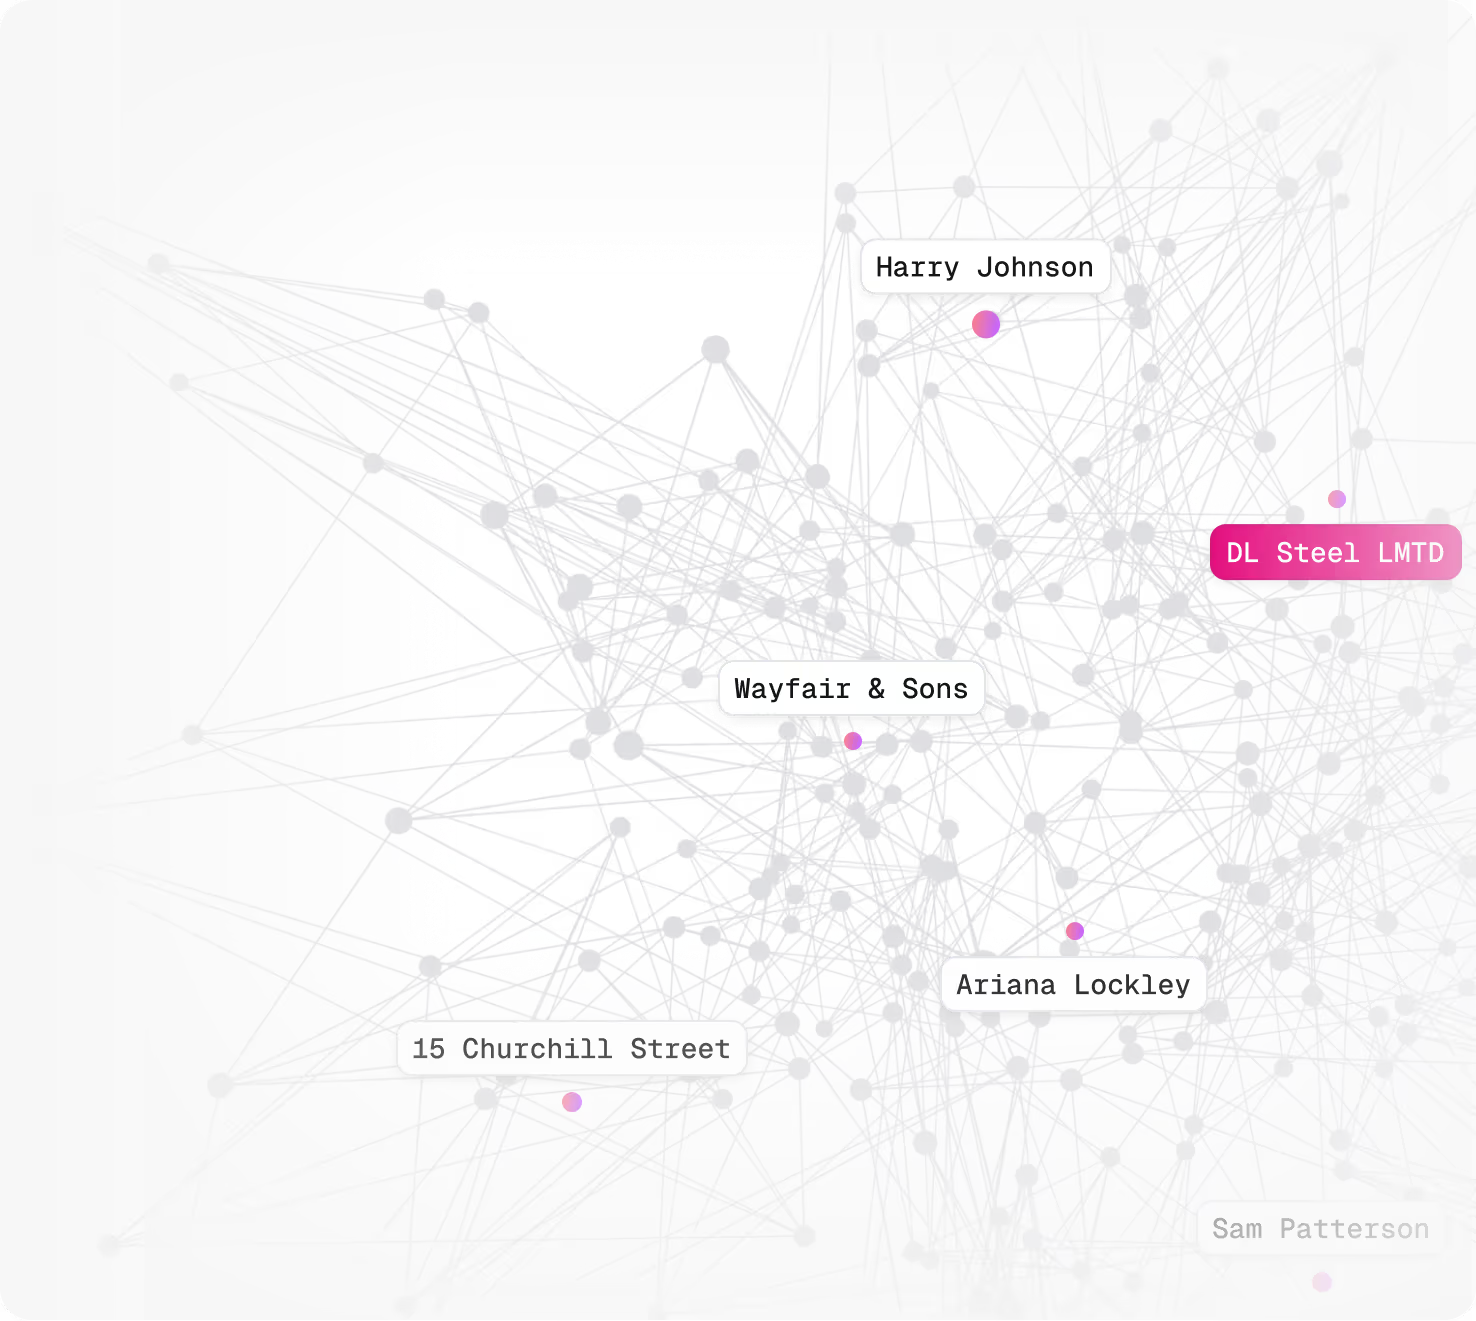
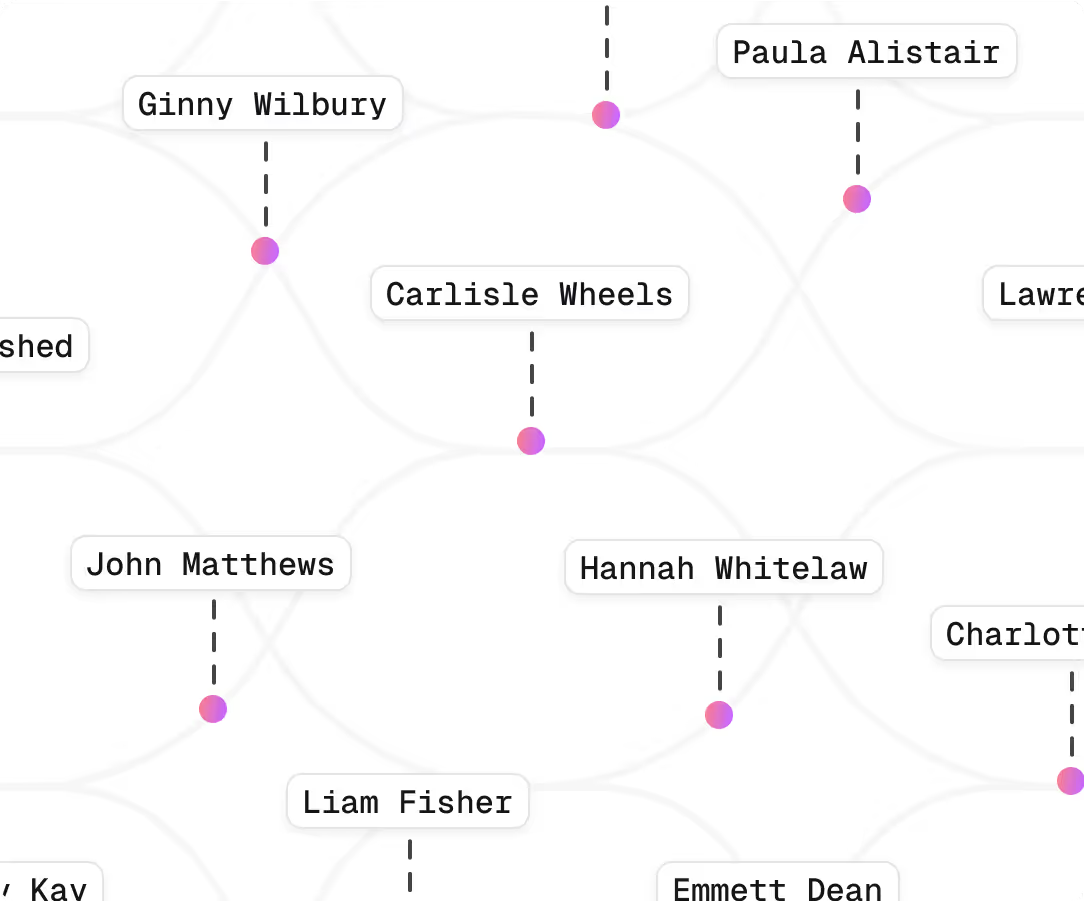
No-Code Visual Exploration
Intuitively navigate relationships, expand connections, and uncover patterns with dynamic graph visualizations and a stunning, easy-to-use interface.
Integrated AI & LLM Interaction
Ask complex questions in natural language and get context-aware answers directly from your graph data via our integrated NeuroSymbolic LLM and GraphRAG tools.
Full Customizability
Adapt themes, colours, icons, and interaction logic. Add custom charts and data displays to side panels via our GraphQL server for a truly bespoke experience.

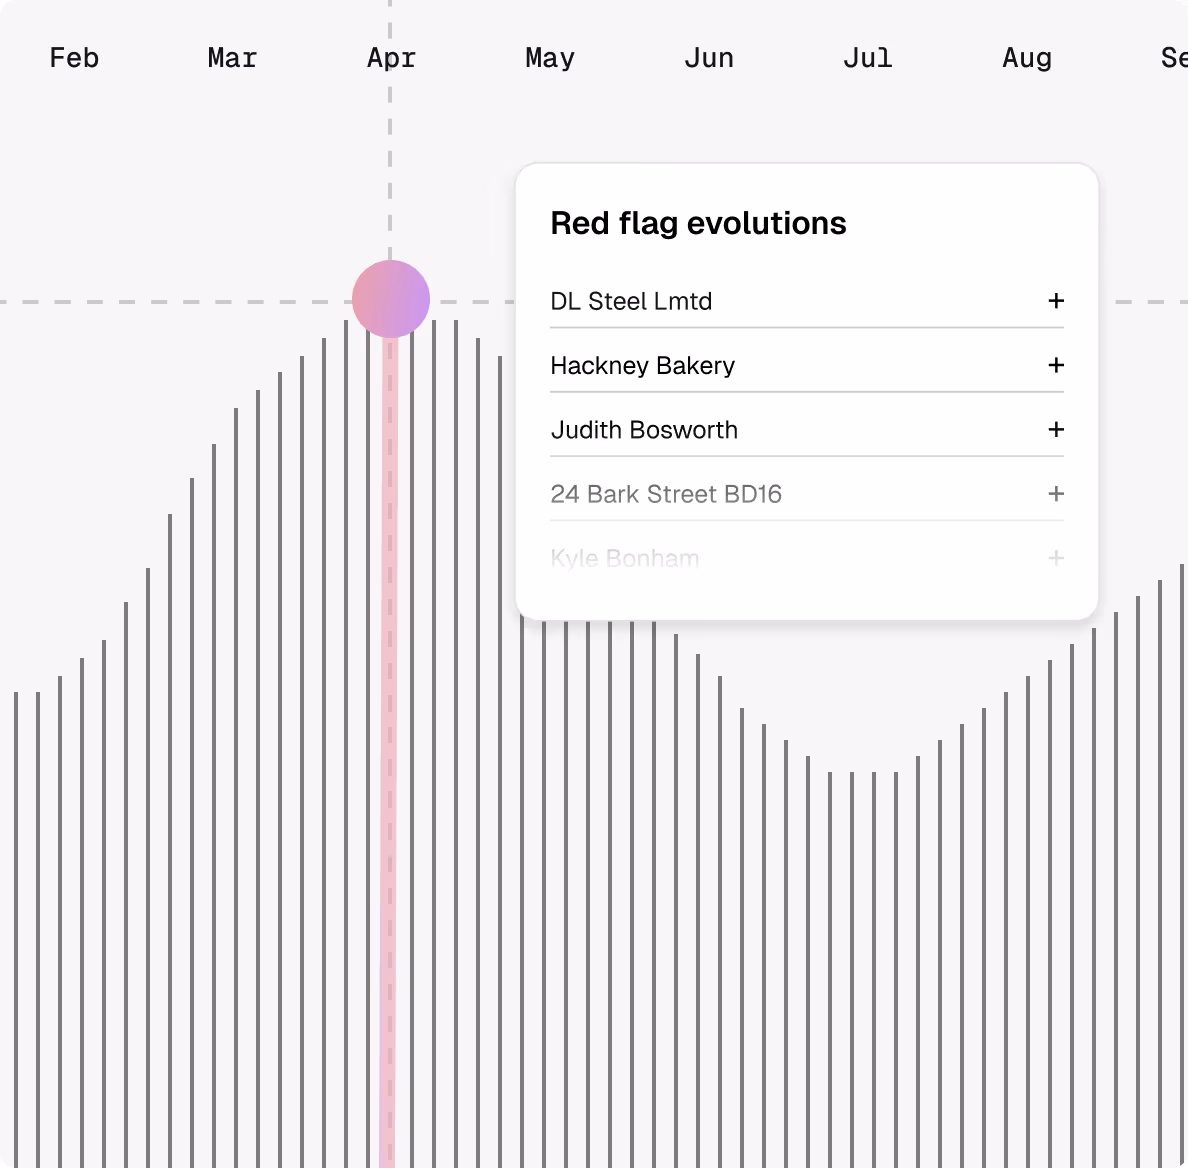
Your Catalyst for Real-Time Temporal Business Intelligence
Transforming Data into Actionable Insights

Trusted by Innovative Companies Worldwide


No! The core graph exploration, visualization, search, LLM interaction, and case management features are available out-of-the-box and require no coding, enabling immediate insights as soon as your data is loaded.
Highly customizable. You can modify themes, colours, icons, graph expansion behaviours, alerts, and scoring. Advanced users and developers can add custom charts and data to side panels (via GraphQL integration) and even modify elements like the RAG pipeline.
It means you can select and enable only the specific functionalities your team requires, such as search, graph exploration, alerts, or LLM/GraphRAG capabilities, creating a tailored workbench experience.
It provides clear visual workflows, data traceability across time, and the ability to easily export and share key findings (visualizations, reports). This allows teams to collaborate effectively on investigations, reporting, and understanding complex data.
Yes, it's built for performance and scalability. It supports smooth search and exploration across graphs with billions of edges and can visualise and interact with subgraphs containing thousands of nodes and hundreds of thousands of edges.
Out-of-the-box, you get powerful full-text and semantic search, direct interaction with our Neurosymbolic LLM for natural language querying, intuitive graph visualization and exploration tools, and an integrated case management system.
Unlock Your Data's Potential with an Intuitive UI
Empower your entire team with Pometry's stunning User Interface. From instant no-code exploration to deep customization and collaborative insight, transform how you interact with your most complex data.