Navigating Financial Complexity: Drive Growth, Mitigate Risk, and Innovate with Temporal Intelligence
The financial services sector operates in an environment of unprecedented data volume, regulatory scrutiny, and dynamic risk. Pometry's natively temporal graph platform empowers financial institutions to transform these challenges into opportunities, unlocking predictive insights, ensuring agile compliance, and building next-generation AI-driven solutions.


Mastering Data, Risk, and Regulation in a Constantly Evolving Market
Financial institutions face intense pressure to innovate while managing evolving risks, complex regulatory landscapes (from MiFID II to AMLD6), and vast, siloed data estates. Success demands a shift from reactive measures to proactive, data-driven strategies that can anticipate change and act with precision.
Achieve Holistic Risk Intelligence
Unify disparate data sources into a dynamic temporal graph for a complete, real-time view of credit, market, operational, and financial crime risks across your enterprise.
Navigate Regulatory Complexity with Agility
Leverage native temporality for immutable audit trails, transparent data lineage, and automated reporting to master complex regulations and adapt swiftly to changes.

Modernise Financial Operations with Temporal Graphs
Empower your institution with dynamic, historically aware data intelligence. Pometry helps you stay ahead of evolving risks, streamline compliance, and unlock new opportunities with a powerful, natively temporal platform built for the future of financial services
Drive AI-Powered Growth & Efficiency
Go beyond simple relationship discovery. Enable AI to analyse behavioural sequences, identify recurring failure patterns, and detect multi-hop risks by examining data dynamics over time.
Unparalleled Data Agility & Insight
Benefit from record-breaking data ingestion, extreme query performance on terabytes of data, and the unique ability to analyse how financial instruments, markets, and behaviours evolve.


Advanced AML & Financial Crime Prevention
Detect sophisticated, evolving financial crime patterns with temporal network analysis, AI-driven anomaly detection, and dynamic risk scoring
Intelligent Asset & Wealth Management
Forecast market shifts, optimise cross-asset portfolios in real-time, and deliver hyper-personalised client experiences with predictive temporal insights.
Dynamic Risk Management & Stress Testing
Model and monitor systemic risk, perform complex "what-if" scenario analysis, and understand cascading impacts through our temporal graph capabilities and Alerts Engine.
Next-Generation KYC & Customer Intelligence
Achieve true Know Your Customer (KYC) with dynamic entity resolution, behavioural analysis over time, and a holistic view of customer interactions and evolving risk profiles.
Real-Time Market Abuse & Surveillance
Proactively identify and investigate market manipulation and abusive trading patterns by analysing the temporal dynamics of trading relationships and activities.
Streamlined Regulatory Reporting & Audit
Leverage native temporality for immutable data records, ensuring transparent, accurate, and efficient generation of regulatory reports and simplified audit processes.

Read our articles

The hidden failures of transformation

Why delivery optimisation is making transformation worse
The Missing Link for AI Agents: Why a Native Temporal Graph is Non-Negotiable

Prisoners Dilemma and advanced Graph analytics

Are Temporal Graphs Relevant to You?

The Graph Model vs. The Relational Model

The Alan Turing Institue: The Dizzy Potential of Dynamic Graphs

Holistic Network Analysis Over Time

Reduce False Positives

High-Performance Investigation at Scale

Advanced Behavioural Sequencing

Unified Temporal Engine for AI

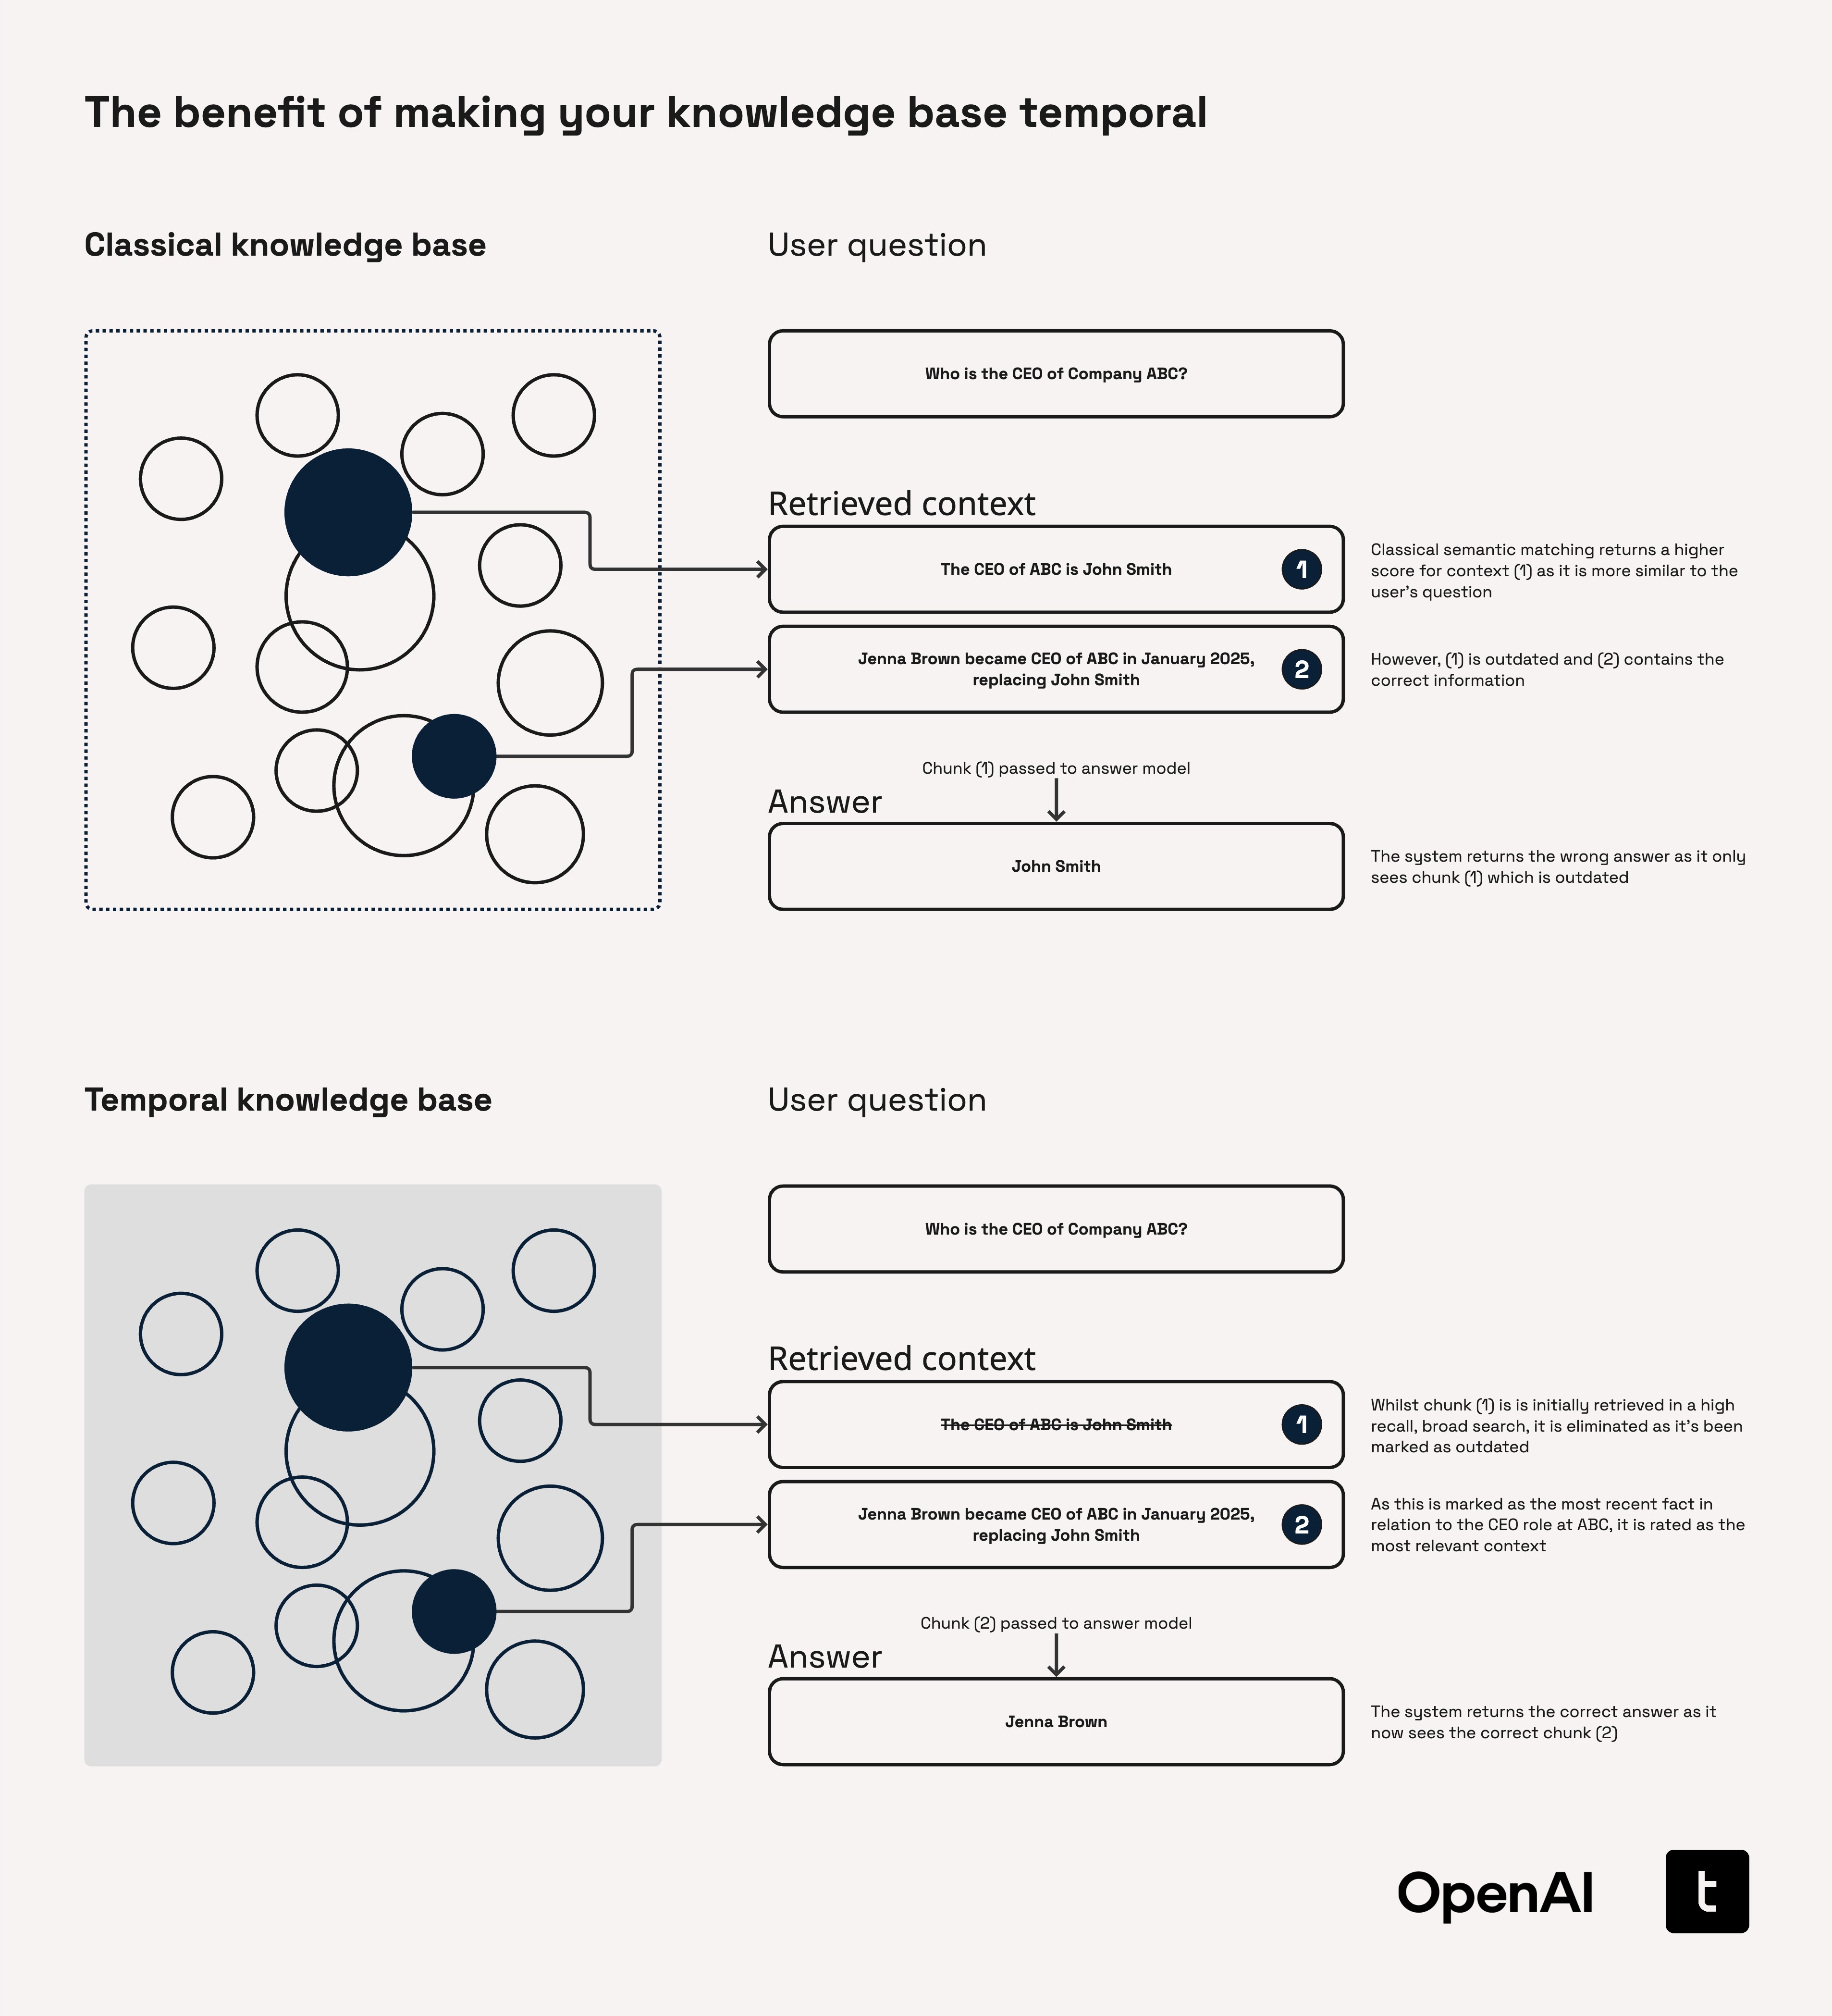
True Semantic Understanding Across Time

High-Performance Context at Scale
Evolving Context Beyond Static Vectors
Dynamic Risk Scoring

Unmasking Collusion & UBOs

Agentic AI Framework Support
.png)
Advanced GraphRAG with Temporal Depth

Build the Future of Finance with Pometry
Equip your institution with the world's only natively temporal graph platform to navigate complexity, drive innovation, and secure a competitive advantage. Discover how Pometry can transform your approach to data, risk, and client value in the financial services industry.