The Graph Model vs. The Relational Model


Graphs have attracted significant interest in recent years. You are probably hearing about all the buzz and how everything is becoming encapsulated around graphs.
For instance, Gartner predicts that by 2025, graph technologies will be used in 80% of data and analytics innovations, up from 10% in 2021, facilitating rapid decision making across the organisation. But what does that mean for you? When should you use a graph model instead of a traditional relational database?
Let's break down the key differences to help you decide.
The Relational Model: A Digital Filing Cabinet
The relational model, which powers most traditional databases (like SQL), organises data into tables with rows and columns. Think of it like a highly organised filing cabinet.
- Tables are Folders: You have separate folders (tables) for each category of information, like
Customers,Orders, andProducts. - Rows are Files: Each file (row) in a folder represents a single item, like a specific customer or order.
- Relationships are References: To connect information, you use "foreign keys." This is like writing a reference note in one file that says, "See file #123 in the 'Orders' folder."
In this model, the structure (the "schema") is rigid. To understand the relationship between a customer and their order, the database has to look up the customer in the Customers table, find the reference key, and then use that key to find the matching entry in the Orders table.

The Graph Model: A Connected Mind Map
The graph model takes a different approach. It's designed to treat the relationships between data points as just as important as the data points themselves. Think of it as a mind map or a social network.
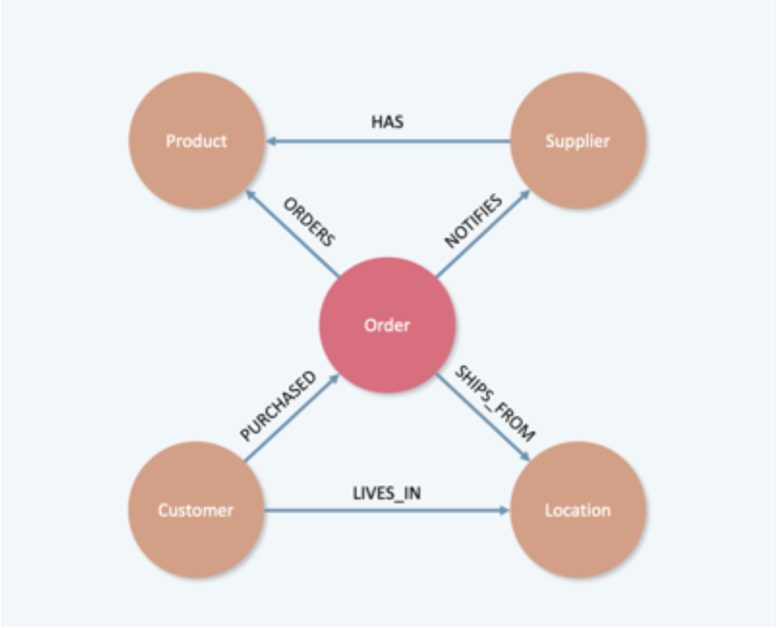
- Nodes are a "Who" or a "What": A node represents an entity, like a
Customer, anOrder, or aLocation. Each node can hold properties, like a customer's name or an order number. - Edges are a "How": An edge is the direct link that describes the relationship between two nodes. It's not a reference; it's a physical connection. For example, a customer node is linked to an order node with an edge that says
PURCHASED.
Using the supply chain example, the story becomes instantly clear: a Customer node has a PURCHASED edge connecting it directly to an Order node, which in turn has a SHIPPED_FROM edge connecting it to a Location node. There are no complex lookups or joins needed; the relationships are built-in.
This structure is also incredibly flexible. Need to add a new piece of information, like a "Return Reason"? You can simply add it as a property to an existing node or create a new type of edge without having to redesign the entire database schema.
At a Glance: Key Differences
Relational Model (Tables)
- Structure: Rigid tables with predefined columns (schema).
- Relationships: Stored indirectly via foreign key lookups, which require "joins."
- Best For: Transactional data and information with a fixed, predictable structure.
- Flexibility: Low. Changing the schema is often complex and resource-intensive.
Graph Model (Nodes & Edges)
- Structure: Flexible nodes and edges that can evolve easily.
- Relationships: Stored directly as dedicated edges between nodes, making connections a core part of the model.
- Best For: Data where the connections are key, such as social networks, fraud detection, and supply chains.
- Flexibility: High. It's simple to add new properties, nodes, and relationships without redesigning the database.
Conclusion: When to Choose Which
The choice is simple when you know what to look for.
- Choose a relational model when your data is highly structured and fits neatly into tables, and your primary need is storing and retrieving discrete records.
- Choose a graph model when the relationships and connections in your data are the most important part of the story. If you need to analyse networks, trace paths, or understand complex systems like supply chains, social networks, or fraud rings, a graph is your most powerful tool.

You might also like
Discover insights and tools for data analysis.

The hidden failures of transformation
Why delivery optimisation is making transformation worse
The Missing Link for AI Agents: Why a Native Temporal Graph is Non-Negotiable
Unlock Your
Data's Potential
Discover how our tool transforms your data analysis with a personalized demo or consultation.