Know how your users actually behave.
Static demographics miss everything that matters. Pometry models your entire user ecosystem, connecting hundreds of millions of interactions into a single, queryable layer that evolves in real time.
more revenue when bank services are personalised
McKinsey & Company, 2021in revenue shifting to personalisation leaders over the next five years
Boston Consulting Group, 2024ROI uplift on marketing spend with Pometry
Pometry analysis, 2025You have data. You don't have context.
Your users leave a trail across every channel: logins, transactions, product interactions, support contacts. But without a way to connect that activity across systems and track how it changes over time, the trail disappears.
Segmentation built on static labels
Demographics tell you who someone is. Behaviour tells you what they do. Most organisations only have one of those, and they're making spend decisions based on it.
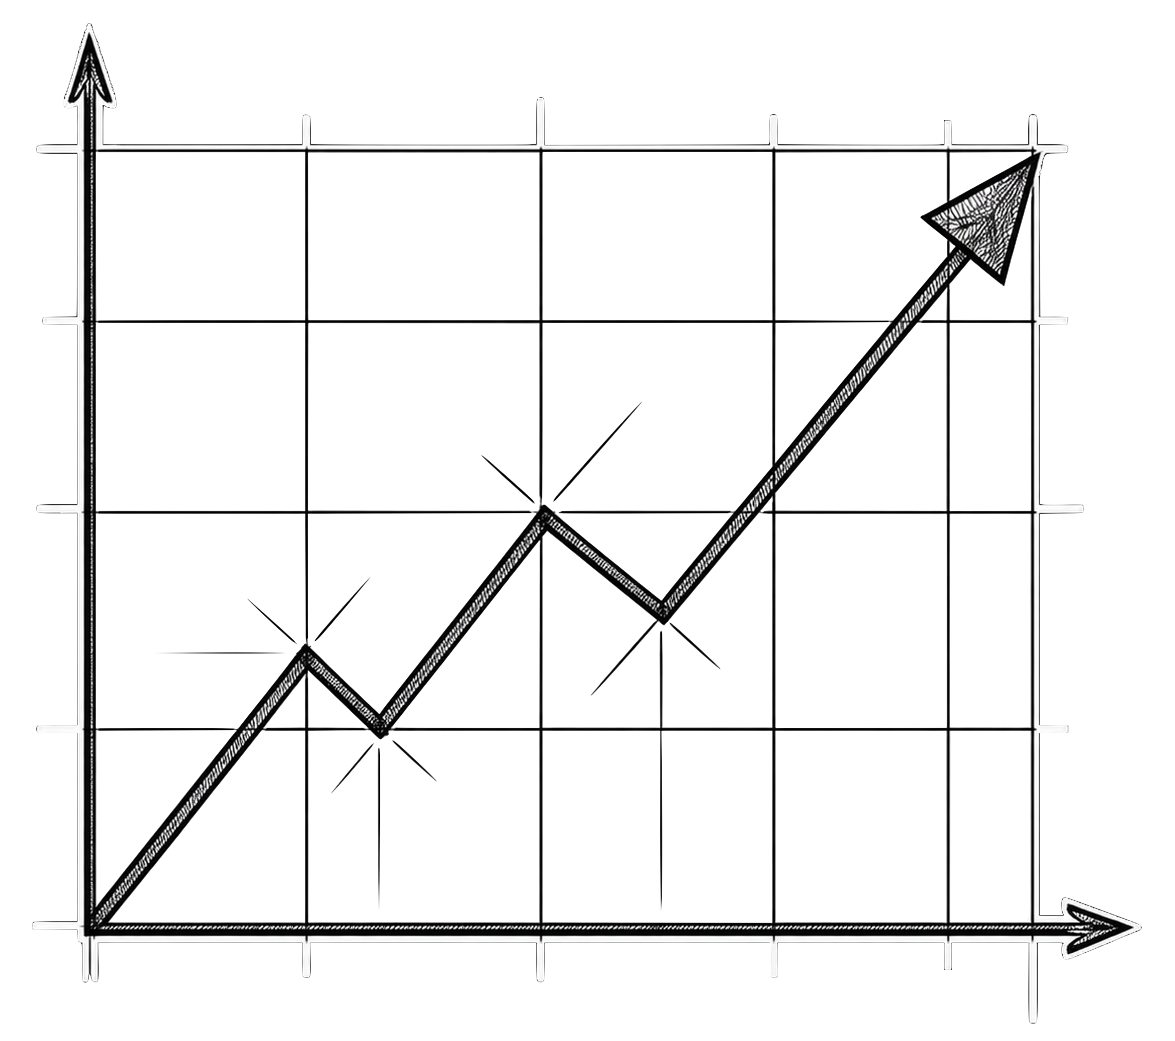
Decisions made on lagging indicators
By the time a report surfaces a trend, the moment to act has often passed. Marketing and product decisions need forward signal, not backward views.
No way to model "what if"
There's no mechanism to ask "if we invest X in segment Y, what's the expected return?", let alone measure it against a live model.
From fragmented data to decision intelligence.
Behavioural Segmentation
Personas built from how users actually behave, not who they are on paper. ~95% accuracy at scale, updated continuously as new data flows in.
What-If Scenario Modelling
Simulate the impact of investment decisions before committing spend, grounded in your live context layer.
Temporal Pattern Detection
Change points, emerging trends, and evolving dynamics surfaced automatically. Segments recalibrate continuously as new data flows in.

Natural Language Queries
Pometry's LLM queries the graph directly. Every answer is grounded in verifiable data, traceable to specific users, interactions, and time points.
See it on your data.
A User Analytics Diagnostic takes 2–4 weeks and delivers behavioural profiles you can act on immediately. Talk to us to find out how we work.
Explore the platform: Explorer · Raphtory · How we work