Graphs vs. Relational model

18 October, 2021

Graphs have attracted significant interest in recent years. You are probably hearing about all the buzz and how everything is becoming encapsulated around graphs.

For instance, Gartner predicts that by 2025, graph technologies will be used in 80% of data and analytics innovations, up from 10% in 2021, facilitating rapid decision making across the organisation.

In this blog, we will dive deeper into the differences between the graph model vs the relational model and get a clearer view on when you might use one over the other.

Graph Model vs Relational Model

The graph model

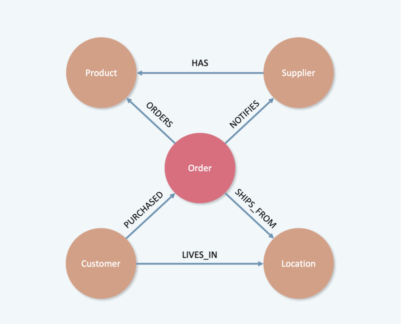
A graph models information as a set of nodes that can be connected by edges. For instance, in a transactional setting, nodes would represent real-world entities and edges a monetary relationship between them denoting a transaction.

Nodes can therefore be thought of as the individual rows in a database whereas the edges as the connections through foreign keys. Attributes in the data like Customer name, Order number, and so more will be directly encoded onto the node structure itself.

In the example above we show how to apply this understanding to model a supply chain. We note that a Customer will often PURCHASE an Order. This Order will then SHIP_FROM a certain Location. The same or different Location which the customer may live in.

Furthermore, if we ever wish to add additional columns to the data, we can simply choose to store this information as a new attribute. Something which is normally hard to do in relational models.

The relational model

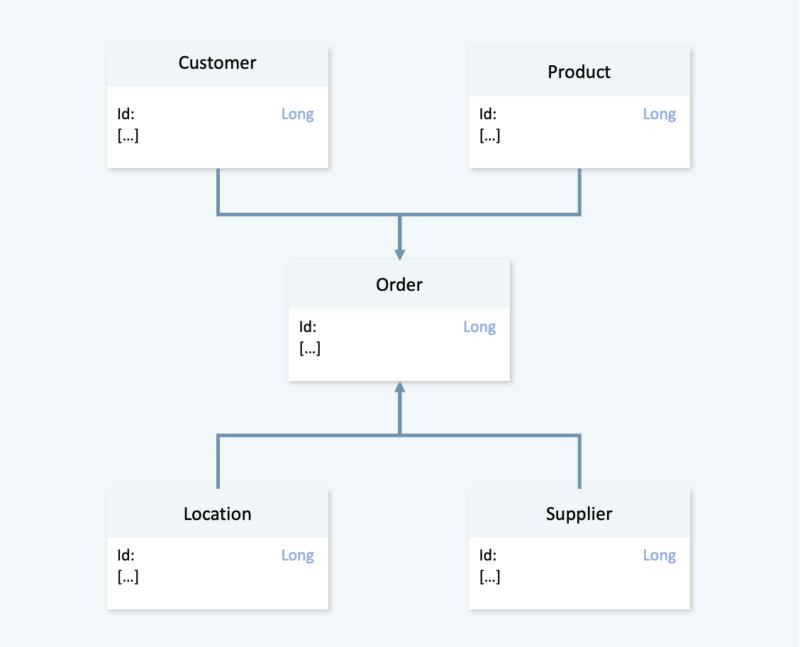
In the relational model, the structure of the data is defined at a much higher level (table schema) with the relationships stored as separate columns rather than edges.

Although this can save space (due to the reduced state of information stored) it evidently provides little flexibility in adding additional attributes and relationships – which now need to be represented as new columns altering the schema.

In a nutshell

When the connections in your data are more important than the entities themself, graphs will provide significant value add and make things much easier to reason about.